#0011: How do I know anyone is listening?

Hey 👋 - Jane here. Welcome to issue #0011 of CVB weekly where I will share some of the most valuable learnings, ideas, and news related to building customer (and audience) value every week. You will find actionable bite-sized tips in each issue. Building customer value unlocks transformational growth, and storytelling is your rocket! 🚀
This weeks edition is focused on the steps you can take to not only talk but listen to your audience at scale. And remember, regardless of size, your audience is made up of current and future customers.
👋 Get CVB weekly (ish) on a Sunday 👋
"How do I know if anyone is listening" is a question that came up this week in a workshop I held in Fiji.
It's a great question!
This video will take you through the content of the newsletter if you find it easier to listen and watch.
First a mindset hack
When it comes to sharing your content and story through digital channels, most of your competitors will talk more than they listen. It's time to use that to your advantage.
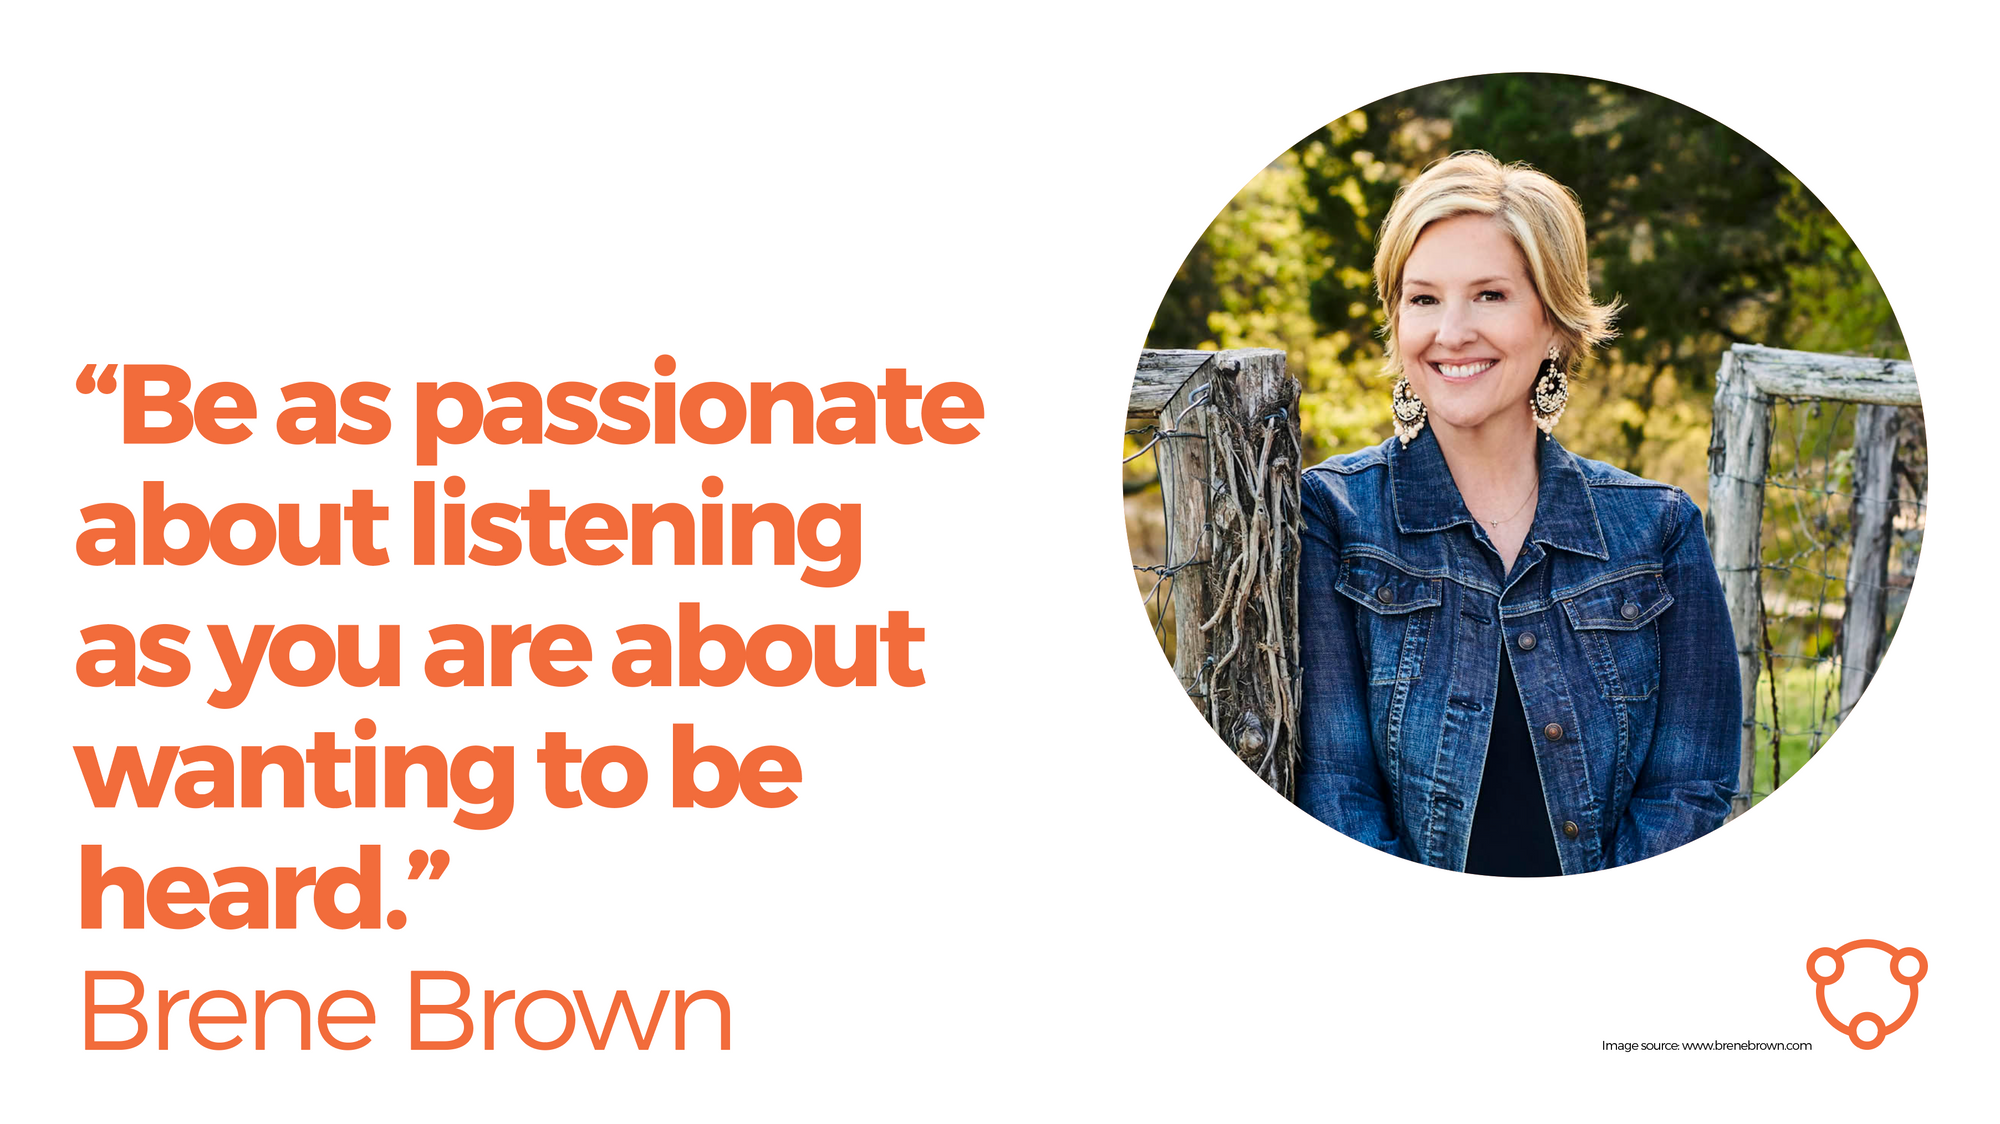
Print this quote off and stick it on your wall.
Second mindset hack.
Data is listening. It is not only for the number nerds but for the storytellers, of whom I am both. But I wasn't always one.... data used to send me running for the door.

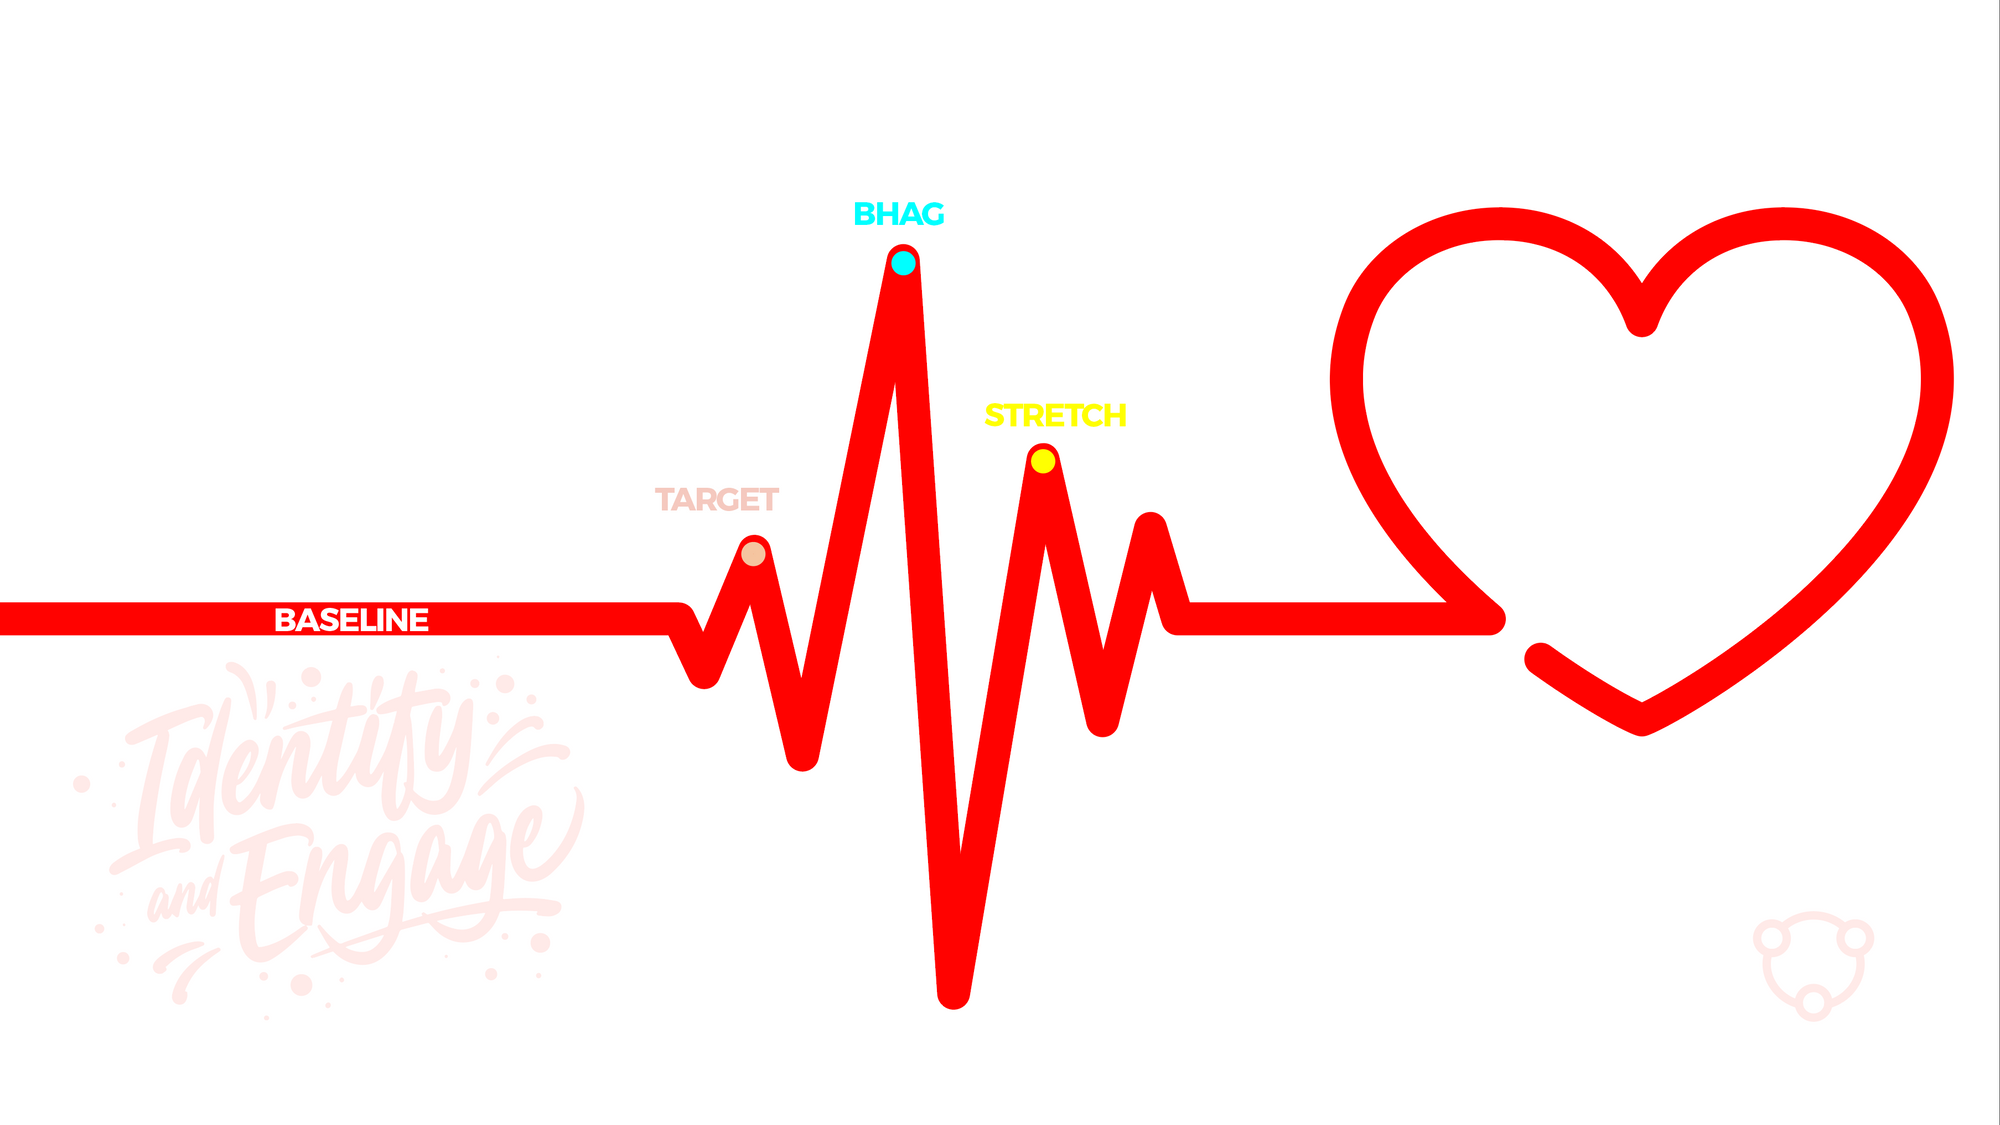
Visualise data as a heartbeat—each piece of data connected to a human being. A peak giving you feedback that a connection has been formed. A trough letting you know when a connection has been lost.
As a founder or marketing leader. it's often hard to know what data matters as we have so much free data at our fingertips. Thousands of rows of data to choose from and that can lead to a feeling of complete overwhelm.

For this newsletter, I am focusing on 4 key areas and to make it simple, I am using the same language you will find in META.
- Insights to understand
- Interactions as feedback
- Engagement for focus
- Action to adapt
1. Insights to understand
Go to your meta dashboard.
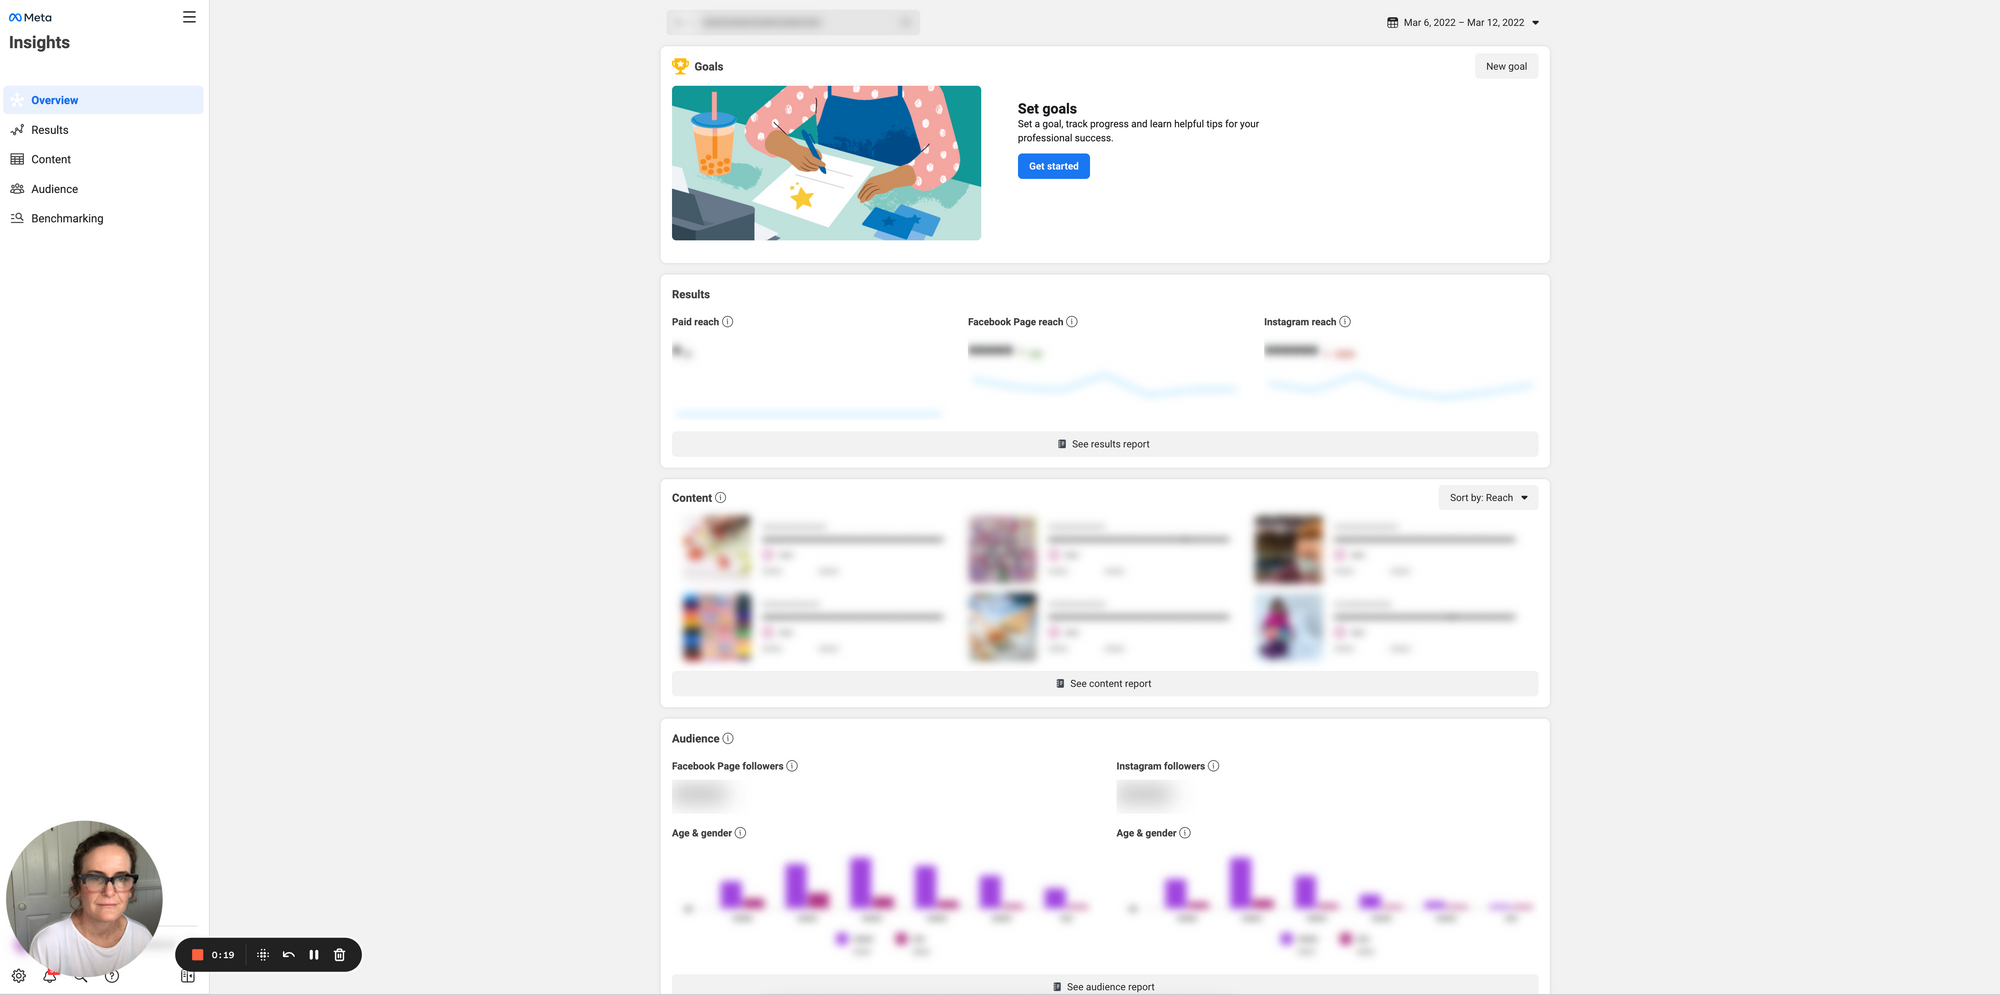
Find your insights tab in Meta and take a look at the overview. It should look a little like this 👇. Make note of your followers at this step as we will use it later. You can also get it from your facebook page or in the app.
2. Interactions as feedback
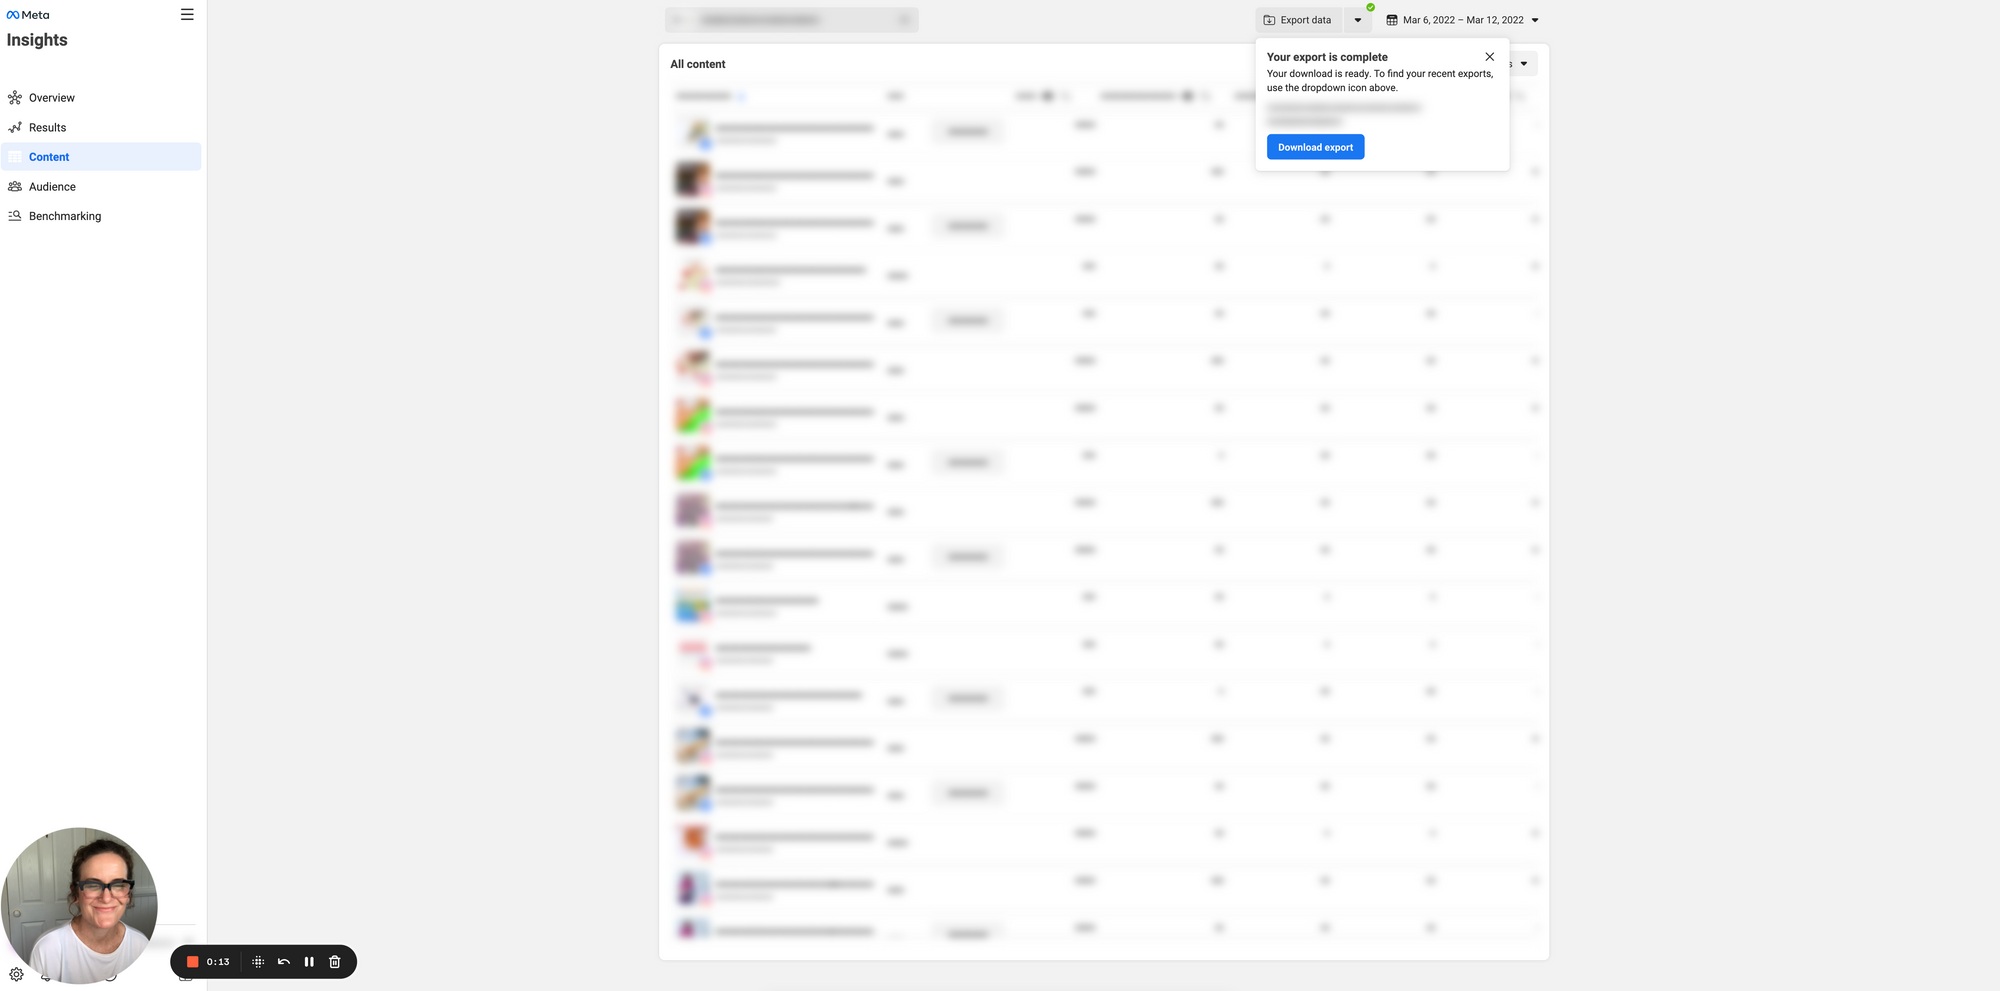
From your meta dashboard, click on your content tab and open up the dashboard that is specifically for your content insights. It should look a little like the image below. Set your weekly date range to give you the most recent week. You can then export the data as an excel spreadsheet or use the new view to find the content with the highest number of interactions.
Interactions are anything where an audience member (existing or future customer) has taken an action. Value that action as it means the audience member has given you there time. Interaction types include the following and I like to add them all up to give me a total number of interactions for each content share. Imagine these interactions are like a head nod as if you were talking to someone in person.
- Likes and reactions
- Sticker taps
- Replies
- Link clicks
- Comments
- Shares
3. Engagement for focus
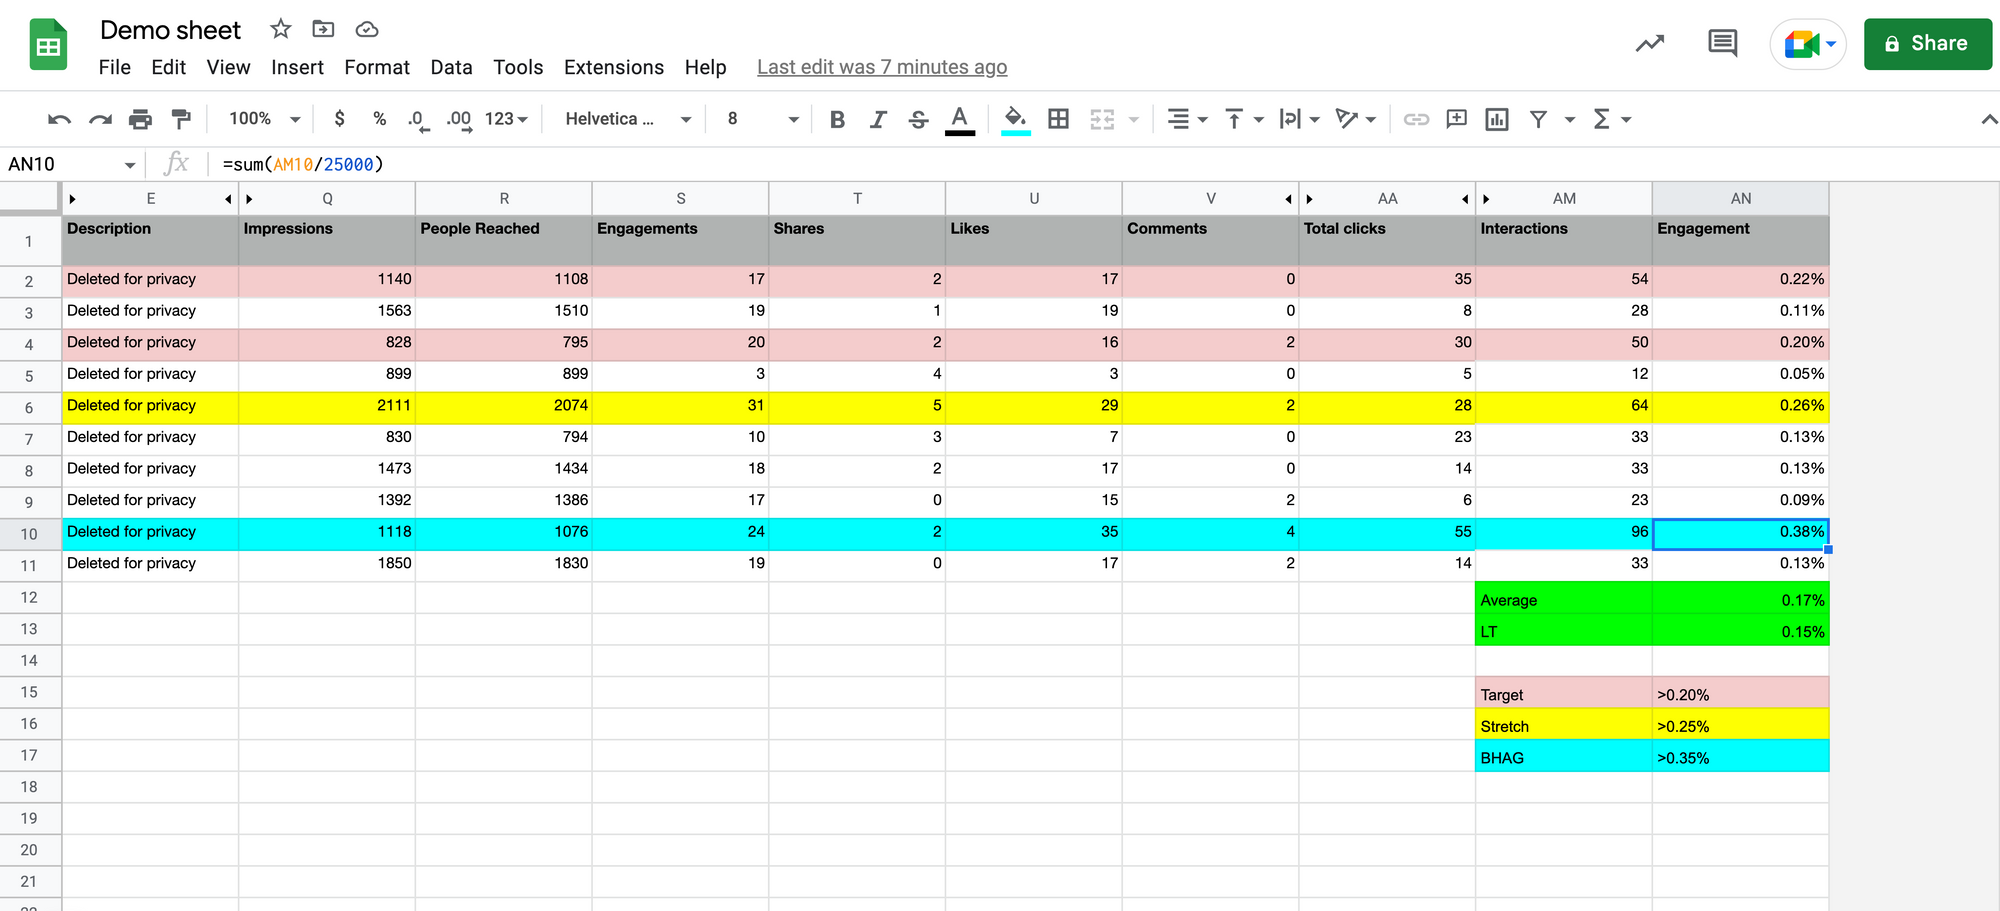
I have created a demo file for you here and it looks like this. It is the same as your dashboard above but I like to move it to excel or google sheets as I can do two new calculations.
- Total interactions. This is where I like to add up all interactions listed above.
- Engagement rate. This is where we calculate the engagement rate for each piece of content. You do that be taking the total number of interactions and dividing it by the total number of followers. There are a lot of different views as to how you can calculate your engagement rate - choose one and stick to it.
4. Action to adjust
I have created a loom video below if you prefer to listen and are a visual person like me. If not, I will step you through it in the content below.
Three things for you to do at this step.
1. Calculate your baseline engagement rate. For this example, the baseline is 0.15%. You can use a tool like Phlanx or simply start with your average for the first week and keep it easy.
2. Set a target, stretch and BHAG. For this example, I highlighted them in pink (target). yellow (stretch) and blue (BHAG). There is no perfect way to do this so set them and keep doing this same exercise for the next 8 weeks and see if you can track a shift in engagement.
3. Choose the highest engagement rate content and spend some time looking at the content to see what makes it different.
- Is it the time/ day?
- Is it the type of content? (video, still, carousel etc)
- Is it the style? (authentic, polished, wild card, etc)
- Is it the subject? (product, BTS, quote, life stories, etc)
4. Take what you learnt and create an experiment to run for the next 8 weeks and see how the experiment impacts on engagement.
Need help?
- Sign to you CVB newsletter where you will get weekly tips and steps you can take to help you become customer focused.
- Create a list of 3-5 great connectors you follow and use them as inspiration.
- Follow me on Instagram, Facebook and Linkedin for more daily inspiration.
- Book in a 1 on 1 session to help fast track the process to help you turn storytelling (and listening) into the engine for growth in your business.
- Register for the Identify and Connect program where I will take you through the 8 step process I use with 9 figure businesses to help them identify and connect with the customer that will grow their business.