CVB #003: My love - hate relationship with data
Let's start first with the 'hate' part of this story.
I was one of those kids who enjoyed maths when I had a great teacher. More often than not, I found that teachers made maths (and
yes, that included when I studied one subject in statistics at Uni) boring. Lacking any colour. All black and white.
I used to battle with Excel for the same reason. I was not too fond of the process of loading data as I couldn't see any of the colours. It was just numbers to me.
I quickly started to use the phrases, "I am more of a creative". "I enjoy human behaviours and emotions".
Numbers are the opposite of that. Or so I thought.
That's when my hate started to turn around
I started by getting curious.
Now, to be honest. It wasn't like a lovely, graceful shift into curiosity. It was more of a clunky, anxiety-riddled shift to curiosity.
The anxiety started around ten years ago when the term 'data-driven marketer' appeared in LinkedIn profiles and the jobs I was applying for.
And it was in the applying for one of those jobs I thought I better get cracking if I am going to be in a position to speak from a place of confidence.
Before the job interview, I read Measure What Matters by John Doerr.
When I was in my role as the digital and design team leader, a colleague gave me the chance to speak to a data scientist. He had won a competition and said, "this might mean more to you than me".
That's where curiosity kicked up a notch.
In that conversation, I saw the link between customer emotions and behaviours to data and a set of critical metrics.
Suddenly data became like a rainbow of opportunities.

He gave me advice that I still use today. So if you are starting your journey towards becoming a data-driven marketer, try these steps.
- Choose five metrics and don't overthink it too much, as you can add more later.
- Create a discipline by setting a time each week to record the data.
- Make a note of any outliers. Try to consider what might be happening. You may not know the answer, and that is ok.
- Do this consistently. Don't change the metrics but rather add more over time.
- Start to ask questions as you become more comfortable with the data.
We now have a complex reporting tool, but it all started with the first five metrics.
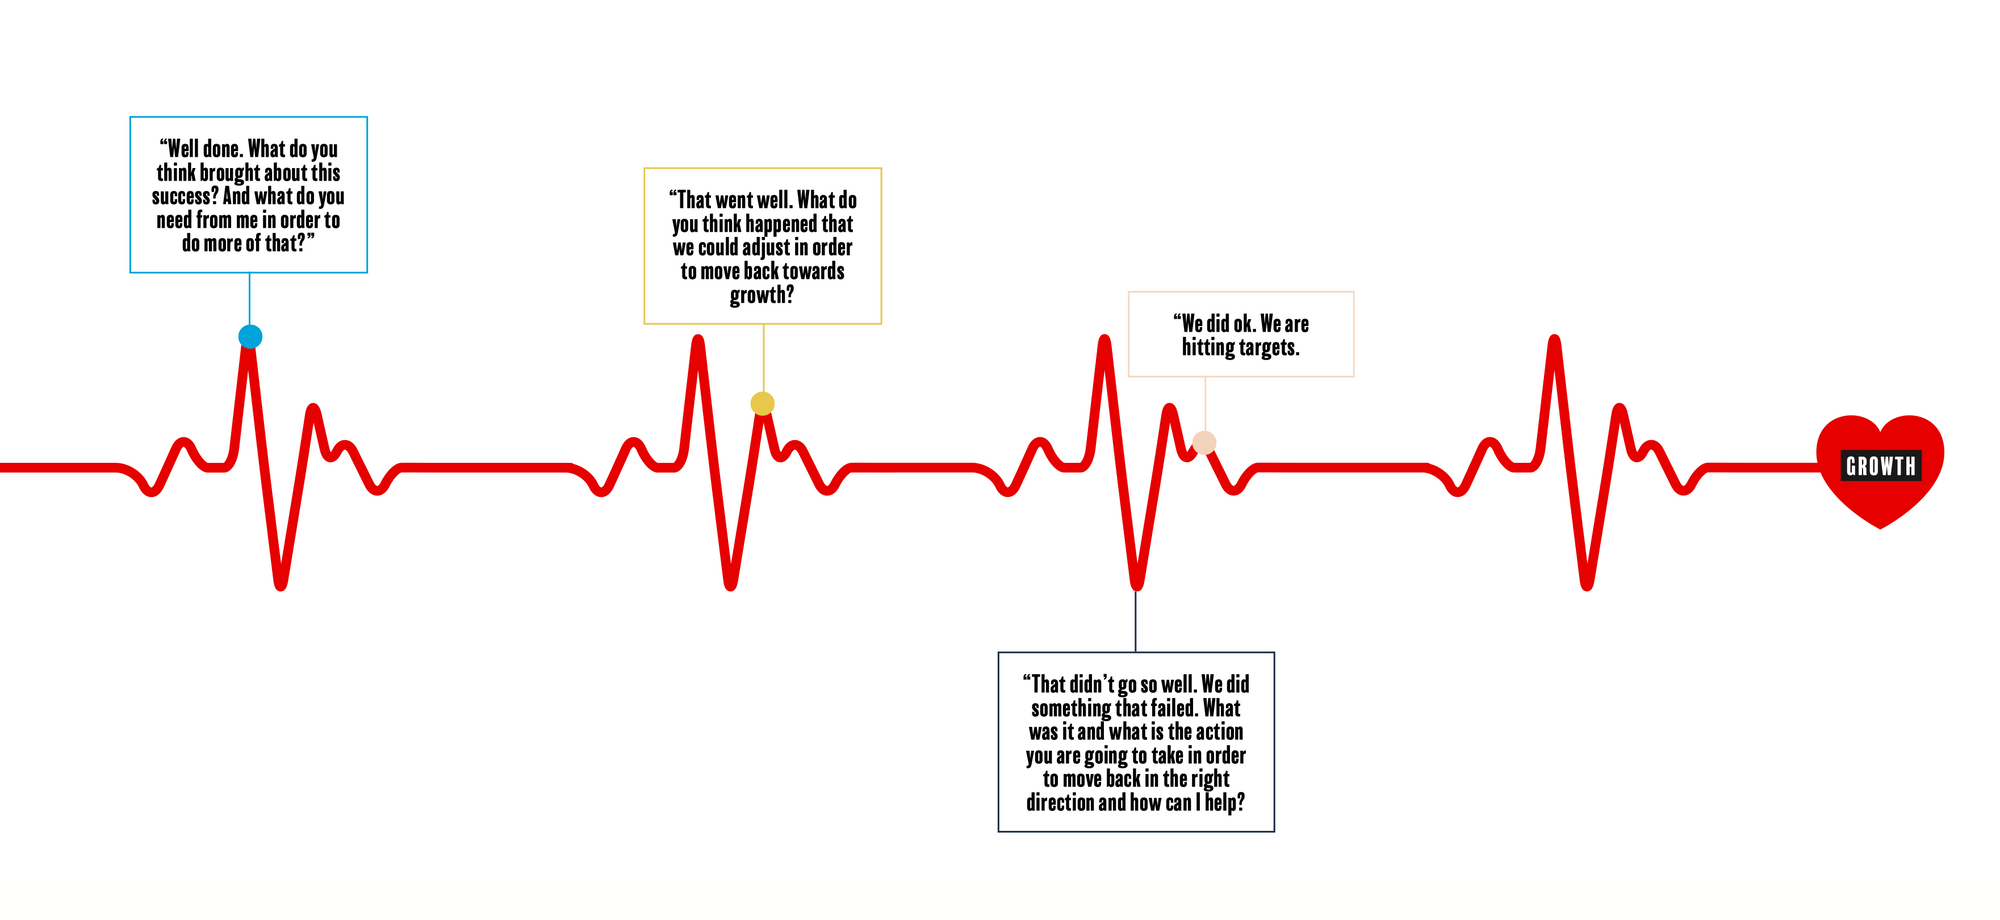
And we see the metrics as a heartbeat that enables us to keep our finger on the pulse of our changing and evolving customers.